Help index
 If this page doesn't give you an answer, please contact us through the contactform
Selection
The use of selection lists
Within a selection list you select one value with the left mouse button. However
there are several ways to select more then one option:
- Select multiple consecutive values with [Shift] + [Left mouse button]
- Select multiple individual values with [Ctrl] + [Left mouse button]
- Navigate through the list by pressing on the first character
Criteria
On this page you can select pollutant or environmental theme, the year, and the
environmental compartment. You can see the resulting map or graph by selecting the
tab [2. Show], which shows the total emissions in the Netherlands. It is also
possible to attune the selection to one or more specific sectors, activities or
facilities using the tab [1. Select] - [1b. Sector/activity].
Emission sources
With an extensive tree structure you can select one or more economical Sectors,
Sub-sectors, Activities and/or individual Facilities. It is possible to select a
complete sublevel after selecting one level (which turns pink after selecting).
Top
Presentation
Graph
The graph shows the development of emissions over the years. Every selected source,
pollutant and sector is represented. The numbering of the lines showing the emissions
is determined by the emission shown for the first year. See the table below the
graph for the legend. You can order the table by selecting the heading of your preference.
All emissions have a maximum of 4 significant digits. You can export the table to
an Excel spreadsheet, which opens in the browser or in a separate window (depending
on your settings).
NB: this is the best way to select your own sources or to see which economic sectors
are important for your pollutant. However, you may want to select a mix of sources
at different levels (sectors, sub-sectors, sources and facilities). Adding up these
emissions in a spreadsheet could result in incorrect totals, so if you want to
see all the sources it's better to use [3. Export] - [3a. Per Sector/activity].
Map
The map only shows emissions from the current selection given in
[1. Select] - [1a. General] and [1. Select] - [1b. Sector/activity].
However, this selection can contain more than one year, source and pollutant and
the map only shows one combination. For this reason you may want to make another
sub-selection in de dropdown lists.
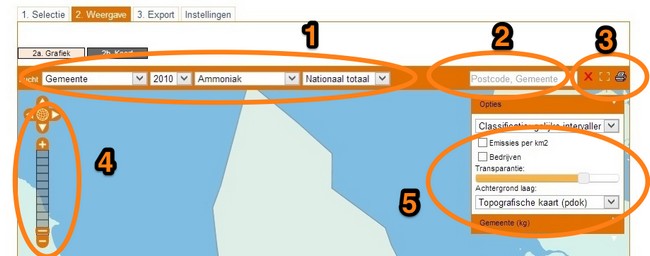
- This section shows the choices made on tabs 1a en 1b. If you want to view a different
year, a different compound or a different sector/activity then the ones supplied in the
picklists you need to return to tab [1. Select] and repick. The picklist with
in this example “gemeente” (municipality) shows the spatial representation layer.
For each compartment (e.g. water, soil) other choices are availeble as representation
layers. Compartments Air and Soil are represenented in grid cells 5x5 km, communal
boundaries, provincial borders and some substances are displayed at 1x1 km grid
cells. Emissions and load to water are displayed by: river basin districts, water board
boundaries and catchment areas (gaf_90).
- This input field is used to search the map. Initially it always searches through postal area
codes. Depending on what is shown on the map other search options become available.
E.g. when facilities are shown on the map than they become searchable; When municipality
is used as a spatial representation, it is searchable. Search by starting to type, after
two characters a result will be shown. It can be refined by continuing to type. After
finding the item you want to see click it to select and zoom to it on the map. Also
by hovering over an option in the picklist it will highlight on the map.
- These three buttons are used to unselect
 , zoom the current map to full screen the current
map by using[
, zoom the current map to full screen the current
map by using[ ]
and use
]
and use
 to print or save a PDF of the current map results. Creating the PDF file requires
up to 10-20 seconds.
to print or save a PDF of the current map results. Creating the PDF file requires
up to 10-20 seconds.
- These buttons are used to navigate the map. Zooming can be achieved by clicking
the vertical bar or + and - buttons. Alternatively you can press [Shift] and drag
the mouse over the map. Or use the mouse scroll wheel for zooming in and out. The arrows
up and down, left and right can be used to pan the map. By clicking the globe you return
to full map view.
- With the options section the map can be further refined. Different background layers
are available. Also alternative classifications can be made, or recalculation to
emissions per km2 can be shown. Please note, if you use the transparancy slider, the colours
in the map change but the legend isn't updated accordingly. So the colours might diverge.
Classification of emissions in map
In general, emissions are not divided equally: many of the emissions are found in
the lower range and a few extreme emissions in the upper range. If the standard
classification of equal values is used, the lowest classes typically represent 90%
of the values. This is why two alternative methods for classification are possible
here: equal count and equal logarithmic value.
- Equal values: maximum value minus minimal value divided by the number of classes
(8) (the standard option)
- Equal count: each class has the same number of values
Top
Export
Per sectory/activity
The tab [3. Export] - [3a. Per sector/activity] gives an export of all sources for the selected pollutant(s),
year(s) and compartment(s). All emissions have a maximum of 6 significant digits.
The selected sources in the tab [1. Select] - [1b. Sector/activity] are not
taken into account.
Per location
The tab [3. Export] - [3b. Per location] gives an export of the regionalized data for the selected
pollutant(s), year(s) and compartment(s). All emissions have a maximum of 6 significant
digits. The selected emission sources in the tab [1. Select] - [1b. Sector/activity] are
not taken into account. You can limit the geographical area by de-selecting [Select
All Areas] and selecting the individual areas or using the advanced filter.
Trouble shooting
Export pop-up does not appear
When a pop up window does not appear or appears shortly and is closed automatically, the solution
is to change the control notification when a pop-up window is blocked. Follow these steps in Internet Explorer:
- Click Tools, point to Pop-up Blocker, and then click Pop-up Blocker Settings.
- Click to select or click to clear the Show Information Bar when a pop-up window
is blocked check box.
- Click Close.
With pop-ups turned on, turn on automatic prompting for file download
- In Internet Explorer, click Tools, and then click Internet Options.
- Click the Security tab.
- There are four security zones listed, choose Internet
- Under Security level for this zone, click Custom Level.
- Scroll down to "Downloads"
- automatic prompting for file downloads, If it is set to Disable, set it to enable
- Clik OK, OK and download again.
Allowing pop-ups in Firefox:
- Click the menu button and choose Options.
- Select the Content panel.
- Uncheck the box next to Block pop-up windows to disable the pop-up blocker altogether.
- click on Exceptions… opens a dialog box with a list of sites that you want to allow to display pop-ups.
Allowing pop-ups in Chrome:
- At the top right, click More (three dots).
- Click Settings.
- At the bottom, click Show advanced settings.
- Under "Privacy," click Content settings.
- Under "Pop-ups," select the option:
- Allow all sites to show pop-ups
Notation of numbers in Excel
Microsoft Excel has a default setting for decimal point or comma. This setting affects
the import of CSV files. In the Dutch version a decimal comma (0,5) is
normally used and in the English version a decimal point (0.5). You can
change this in the settings of the Windows control panel by selecting 'Regional
and language Options' or in Excel by selecting 'Tools - Options - International'.
In Excel 2010/2013 you can find this option at File -> Options -> Advanced -> Use system seperators.
Top
Settings
All emissions are presented in whole numbers, standard as kilograms per year. Here
you can select another unit, e.g. grams per year for dioxin or kilotonne for CO2.
The selected unit is used in the graph, map and spreadsheet. However,
in the tab [3. Export] the data is always presented with 6 significant digits,
in kg and with a decimal point (in the Netherlands a decimal comma is standard).
See Numbers in Excel, decimal point or comma.
Top
Search
Search documents
After selecting [Search in documents] in the menu to the left, you can search any
string inside the document itself. Documents may be written in Microsoft Word, Adobe
PDF, Microsoft Powerpoint, Microsoft Excel or HTML pages. Your search-string should
contain at least 2 characters and may contain a combination of the following keywords.
- Emission
- "Emi*"
- Emission AND 2010
- Emission NEAR 2010
- "Emi*" AND IPCC
Search facilities
When the field facility is selected you can search for a facility on a map by typing
at least 2 characters of the name of the facility next to the button and pressing
[Search]. One or more names are shown below. Selecting one name moves and centers
the map to the given location.
Search postal/zip-code
In the homepage and in the page with the map itself (Show - Map) you can give in
the four digits (xxxx) of your postal code. The map will zoom to that area.
Search in a map
You can search for names in a selected layer of the map (province, municipality,
river basin district, catchment area or water board). Just type in at least two letters and press the
search button.
Top
