How to interpret the emissiondata
This page explains the various limitations in the quality of our emission data.
Embargo sheet
In some cases the emissions of certain compounds are incomplete, or we don't have
a clear picture of the allocation in the Netherlands. This embargo sheet shows these
exceptions.
No spatial distribution of pesticide emissions from agriculture
This year, in consultation with Wageningen Environmental Research (WenR) and Deltares, it was decided not to publish a spatial distribution for the time being of pesticide emissions from agriculture. Spatial distributions in previous years were based on the 2008 NMI3 model. The results of NMI3 are suitable for generating trends and relative differences between applications of the same type. However, the results of NMI3 are not suitable for statements about emissions and / or risks at a specific location and at a specific time.
In collaboration with WenR, Deltares and CBS are currently implementing a new method that incorporates the most recent insights and where the spatial level of detail reflects the uncertainties within the basic data and models used. These new data are expected to become available in the course of 2021, so that they will be published as soon as possible via the website of the Emission Registration. National totals for pesticide emissions from agriculture can be requested.
The symbol
 indicates no limitations, the symbol
 implies that no information is shown at all from this compounds at this level, while
 indicates some restrictions, further explained - as a tooltip - when you point the
symbol.
indicates some restrictions, further explained - as a tooltip - when you point the
symbol.
- Most detailed level (1x1km) only available in 2015, 2017 and 2018 for CO2, NH3, NOx, Particulate Matter (PM10, PM2.5) and SO2, all years up to target subgroup .
Agricultural sector : a) NH3 2000, 2005, 2010, 2015, 2017 and 2018: most detailed level 5x5km, 2000 and 2005 only up to target group; b) CH4, N2O: only for the years 2015, 2017 and 2018; c) PM10 and PM2.5 are shown for 2010, 2015, 2016 and 2017; d) Pesticides are shown only for 2005, 2010, 2015, 2016 en 2017 . Wastedisposal (CH4, NH3, NOx , N2O, SO2) only shown for 2010, 2015, 2016 and 2017.
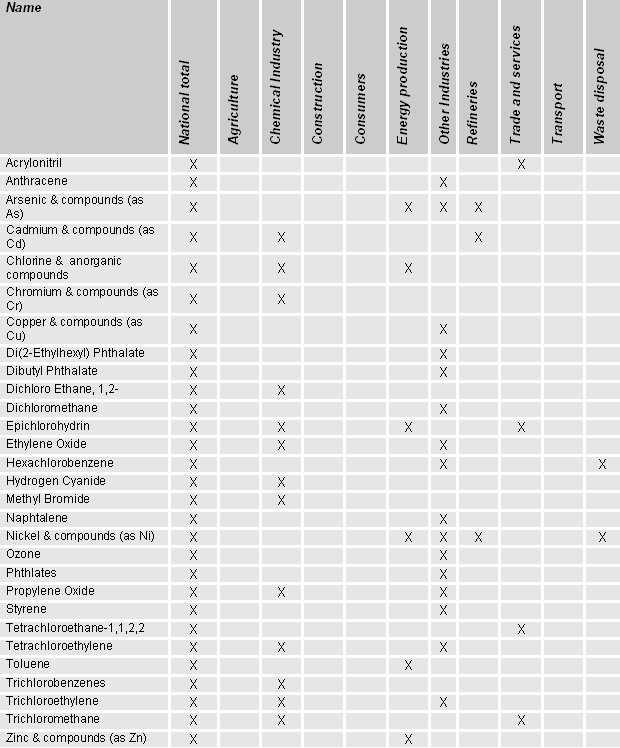
- For exceptions see the report about priority substances
Emissies van prioritaire stoffen naar lucht in Nederland 1990-2005 (Peek
2008) Attachment I, table B1, see also the table below.
- Pesticides: No spatially distributed data available yet for agriculture
Top
Methodologies, protocols and factsheets used
How the emissions are determined is briefly discussed in the
methods, with a detailed explanation given in the so-called methodology
reports. You can locate all the documents via the
documentation menu. You can locate all the documents via the Search bar above,
which will lead you directly to the relevant methodology, factsheet or protocol.
Top
Uncertainties in emissions
The uncertainties in emissions are significant and will even increase after allocating
them spatially (see also the remarks in the description of the
emission calculations). Three studies were carried out to quantify the
uncertainties: two on greenhouse gas emissions and one focussing on acidifying compounds
(NOx, SO2 and NH3 and large-scale air pollution.
Reports on the studies are available
here.
|
Pollutant or environmental theme
|
Uncertainty in the national total
|
Methodology
|
|
CO2
|
±3%
|
Tier 1
|
|
CH4
|
±25%
|
Tier 1
|
|
N2O
|
±50%
|
Tier 1
|
|
Fluor gases (F-gases)
|
±50%
|
Tier 1
|
|
CO2-equivalents (theme greenhousegases)
|
±5%
|
Tier 1
|
|
NH3
|
±17%
|
Tier 2
|
|
NOx
|
±15%
|
Tier 2
|
|
SO2
|
±6%
|
Tier 2
|
|
Acid equivalents (theme accidification)
|
±10%
|
Tier 2
|
Top
Improvements for next release
- Incorrect data sea shipping emissions
Unfortunately, an error has occurred concerning sea shipping emissions 2013. Within
the 12-mile zone, no emissions are shown on the map, which is not correct. Furthermore,
total emissions from the sources ‘Anchored NCP, Other ships’ and ‘Sailing NCP, Other
ships’ are too high as some of the emissions for fisheries are also partly included
here. Adjustments will be made when the website is updated (May/June 2016). Meanwhile,
an email can be send using the contactform to obtain the correct emission
data.
Top
